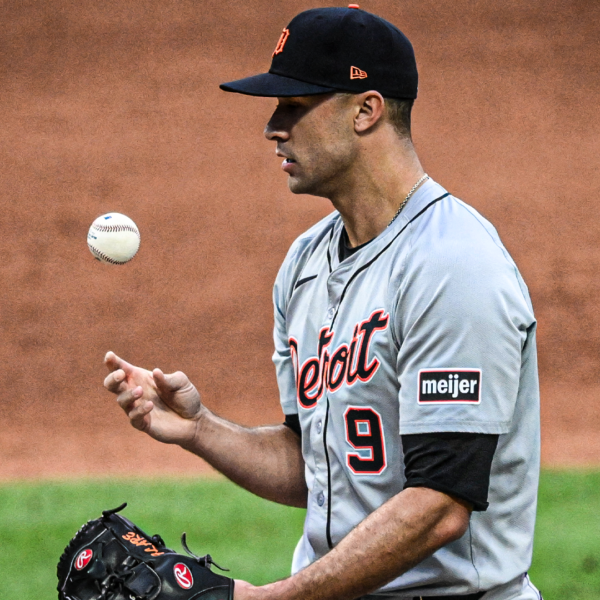
Has Detroit Tigers closer Gregory Soto actually gotten…better?
Throughout Detroit sports history, the closer for the Detroit Tigers has always been a tough plain to navigate. Just as with the goalie for the Red Wings, or the quarterback for the Lions, when fans see a Tigers closer struggle at all they immediately start calling for change.
In the case of left-hander Gregory Soto, it fits the narratives of closers past. Jose Valverde, Todd Jones and Guillermo Hernandez all dealt with levels of scrutiny. Valverde, while converting all 49 of his save opportunities in 2011, would still get negative comments about his level of excitement after he closed out a game, or complaints about his performance in non-save situations.
Hernandez was an All-Star in 1986, but he had a bad August, and after being the automatic choice to be closer, by September, he had been moved to the stopper role. He was 21-for-26 in save opportunities, but he allowed 13 home runs in 81 innings of work. The stats showed a decline in effectiveness, and by 1987 his role was reduced even more.
Todd Jones’s nickname was the “Roller Coaster” but he remains the all-time leader in Tigers history in saves at 235. He averaged around a 86% save conversion rate throughout his career in Detroit. Both Jones and Hernandez pitched in two completely different eras. So that’s where the comparison stops.
The numbers are there for Soto
Soto’s strikeout numbers this season are among the lowest for Tigers relievers. He is fourth in K per 9 with 9.31 and K% is at 24.2%. Last season he finished with a 10.74 K per 9 and 27.5% K rate.
So that’s a legit gripe. But some numbers have gotten better for Soto. Even with his three-walk meltdown on Sunday, he is walking batters at a career-low rate of 4.42 per 9. That continues a drop from 2020 where his walk rate was 5.65 per 9. His FIP (3.40) is slightly higher than his ERA (3.26), but it is still the lowest of his career.
But manager A.J. Hinch probably only really cares about one number, and that is Gregory Soto’s save percentage. How often does he close out wins when he is called on to do so?
| Rk | Player | SV% ▼ | SV | Age | Team | Lg | W | L | W-L% | ERA | G | SV | IP | H | R | ER | HR | BB | IBB | SO | HBP | BK | WP | BF | ERA+ | FIP | WHIP | H9 | HR9 | BB9 | SO9 | SO/BB | IR | IS | IS% | BSv | SV% | GF | GR | Pos |
|---|---|---|---|---|---|---|---|---|---|---|---|---|---|---|---|---|---|---|---|---|---|---|---|---|---|---|---|---|---|---|---|---|---|---|---|---|---|---|---|---|
| 1 | Josh Hader | 93.5 | 29 | 28 | MIL,SDP | NL | 2 | 4 | .333 | 4.00 | 39 | 29 | 36.0 | 27 | 16 | 16 | 7 | 12 | 0 | 62 | 1 | 0 | 4 | 148 | 102 | 3.28 | 1.083 | 6.8 | 1.8 | 3.0 | 15.5 | 5.17 | 4 | 0 | 0 | 2 | 93.5 | 36 | 39 | |
| 2 | Emmanuel Clase | 92.3 | 24 | 24 | CLE | AL | 2 | 2 | .500 | 1.36 | 48 | 24 | 46.1 | 26 | 10 | 7 | 2 | 6 | 1 | 48 | 0 | 0 | 3 | 171 | 286 | 1.99 | 0.691 | 5.1 | 0.4 | 1.2 | 9.3 | 8.00 | 1 | 0 | 0 | 2 | 92.3 | 43 | 48 | |
| 3 | Daniel Bard | 92.0 | 23 | 37 | COL | NL | 3 | 3 | .500 | 1.99 | 40 | 23 | 40.2 | 23 | 11 | 9 | 3 | 19 | 1 | 45 | 2 | 0 | 2 | 168 | 232 | 3.41 | 1.033 | 5.1 | 0.7 | 4.2 | 10.0 | 2.37 | 2 | 0 | 0 | 2 | 92.0 | 32 | 40 | 1 |
| 4 | Gregory Soto | 90.9 | 20 | 27 | DET | AL | 2 | 6 | .250 | 3.26 | 40 | 20 | 38.2 | 28 | 20 | 14 | 1 | 19 | 0 | 40 | 7 | 0 | 1 | 165 | 122 | 3.40 | 1.216 | 6.5 | 0.2 | 4.4 | 9.3 | 2.11 | 9 | 2 | 22 | 2 | 90.9 | 34 | 40 | |
| 5 | Edwin Díaz | 89.7 | 26 | 28 | NYM | NL | 2 | 1 | .667 | 1.39 | 45 | 26 | 45.1 | 27 | 7 | 7 | 3 | 12 | 1 | 91 | 1 | 0 | 2 | 172 | 288 | 0.82 | 0.860 | 5.4 | 0.6 | 2.4 | 18.1 | 7.58 | 6 | 2 | 33 | 3 | 89.7 | 38 | 45 | 1 |
| 6 | Camilo Doval | 88.2 | 15 | 24 | SFG | NL | 3 | 5 | .375 | 2.93 | 47 | 15 | 46.0 | 37 | 21 | 15 | 4 | 19 | 1 | 58 | 2 | 0 | 3 | 195 | 139 | 3.09 | 1.217 | 7.2 | 0.8 | 3.7 | 11.3 | 3.05 | 13 | 5 | 38 | 2 | 88.2 | 35 | 47 | |
| 7 | Liam Hendriks | 88.0 | 22 | 33 | CHW | AL | 2 | 3 | .400 | 3.11 | 37 | 22 | 37.2 | 30 | 15 | 13 | 5 | 9 | 1 | 56 | 1 | 0 | 5 | 153 | 129 | 2.66 | 1.035 | 7.2 | 1.2 | 2.2 | 13.4 | 6.22 | 7 | 4 | 57 | 3 | 88.0 | 33 | 37 | 1 |
| 8 | Craig Kimbrel | 87.0 | 20 | 34 | LAD | NL | 3 | 4 | .429 | 4.15 | 41 | 20 | 39.0 | 41 | 21 | 18 | 1 | 17 | 1 | 54 | 2 | 1 | 6 | 177 | 99 | 2.14 | 1.487 | 9.5 | 0.2 | 3.9 | 12.5 | 3.18 | 3 | 1 | 33 | 3 | 87.0 | 35 | 41 | |
| 9 | Jordan Romano | 86.2 | 25 | 29 | TOR | AL | 4 | 3 | .571 | 2.59 | 42 | 25 | 41.2 | 30 | 15 | 12 | 4 | 14 | 1 | 46 | 2 | 0 | 0 | 169 | 153 | 3.30 | 1.056 | 6.5 | 0.9 | 3.0 | 9.9 | 3.29 | 7 | 1 | 14 | 4 | 86.2 | 37 | 42 | |
| 10 | Kenley Jansen | 85.7 | 24 | 34 | ATL | NL | 5 | 0 | 1.000 | 3.57 | 40 | 24 | 40.1 | 29 | 17 | 16 | 5 | 11 | 1 | 55 | 0 | 0 | 0 | 160 | 118 | 2.81 | 0.992 | 6.5 | 1.1 | 2.5 | 12.3 | 5.00 | 4 | 3 | 75 | 4 | 85.7 | 33 | 40 | |
| 11 | Scott Barlow | 85.0 | 17 | 29 | KCR | AL | 4 | 4 | .500 | 2.22 | 48 | 17 | 52.2 | 42 | 18 | 13 | 6 | 15 | 1 | 50 | 3 | 0 | 3 | 211 | 186 | 3.72 | 1.082 | 7.2 | 1.0 | 2.6 | 8.5 | 3.33 | 27 | 11 | 41 | 3 | 85.0 | 31 | 48 | 1 |
| 12 | Raisel Iglesias | 84.2 | 16 | 32 | ATL,LAA | AL,NL | 2 | 6 | .250 | 3.82 | 41 | 16 | 37.2 | 30 | 18 | 16 | 5 | 9 | 1 | 51 | 2 | 0 | 3 | 153 | 107 | 3.00 | 1.035 | 7.2 | 1.2 | 2.2 | 12.2 | 5.67 | 14 | 8 | 57 | 3 | 84.2 | 33 | 41 | |
| 13 | Ryan Pressly | 84.0 | 21 | 33 | HOU | AL | 3 | 3 | .500 | 3.09 | 33 | 21 | 32.0 | 22 | 12 | 11 | 2 | 9 | 0 | 38 | 0 | 0 | 0 | 122 | 126 | 2.39 | 0.969 | 6.2 | 0.6 | 2.5 | 10.7 | 4.22 | 2 | 1 | 50 | 4 | 84.0 | 30 | 33 | |
| 14 | Mark Melancon | 83.3 | 15 | 37 | ARI | NL | 3 | 10 | .231 | 4.54 | 42 | 15 | 37.2 | 46 | 27 | 19 | 2 | 15 | 2 | 27 | 1 | 0 | 4 | 172 | 89 | 3.64 | 1.619 | 11.0 | 0.5 | 3.6 | 6.5 | 1.80 | 2 | 0 | 0 | 3 | 83.3 | 35 | 42 | 1 |
| 15 | David Bednar | 81.0 | 17 | 27 | PIT | NL | 3 | 4 | .429 | 2.70 | 40 | 17 | 46.2 | 36 | 18 | 14 | 4 | 14 | 2 | 63 | 1 | 1 | 2 | 188 | 156 | 2.49 | 1.071 | 6.9 | 0.8 | 2.7 | 12.2 | 4.50 | 8 | 1 | 13 | 4 | 81.0 | 32 | 40 | 1 |
| 16 | Clay Holmes | 81.0 | 17 | 29 | NYY | AL | 5 | 3 | .625 | 2.27 | 47 | 17 | 47.2 | 33 | 13 | 12 | 1 | 14 | 2 | 51 | 7 | 0 | 1 | 195 | 170 | 2.57 | 0.986 | 6.2 | 0.2 | 2.6 | 9.6 | 3.64 | 17 | 3 | 18 | 4 | 81.0 | 24 | 47 | |
| 17 | Jorge López | 80.0 | 20 | 29 | BAL,MIN | AL | 4 | 6 | .400 | 1.75 | 47 | 20 | 51.1 | 33 | 16 | 10 | 3 | 18 | 1 | 57 | 4 | 2 | 2 | 209 | 232 | 2.94 | 0.994 | 5.8 | 0.5 | 3.2 | 10.0 | 3.17 | 16 | 2 | 13 | 5 | 80.0 | 37 | 47 | 1 |
| 18 | Taylor Rogers | 80.0 | 28 | 31 | MIL,SDP | NL | 1 | 5 | .167 | 4.36 | 44 | 28 | 43.1 | 39 | 23 | 21 | 1 | 10 | 1 | 51 | 8 | 0 | 1 | 183 | 88 | 2.30 | 1.131 | 8.1 | 0.2 | 2.1 | 10.6 | 5.10 | 11 | 3 | 27 | 7 | 80.0 | 35 | 44 | 1 |
| 19 | Tanner Scott | 78.9 | 15 | 27 | MIA | NL | 4 | 4 | .500 | 4.23 | 47 | 15 | 44.2 | 33 | 25 | 21 | 3 | 30 | 0 | 64 | 3 | 0 | 2 | 199 | 97 | 3.33 | 1.410 | 6.6 | 0.6 | 6.0 | 12.9 | 2.13 | 3 | 2 | 67 | 4 | 78.9 | 27 | 47 | 1 |
| 20 | David Robertson | 75.0 | 15 | 37 | CHC,PHI | NL | 3 | 0 | 1.000 | 2.13 | 38 | 15 | 42.1 | 24 | 10 | 10 | 4 | 20 | 0 | 54 | 3 | 0 | 2 | 173 | 198 | 3.42 | 1.039 | 5.1 | 0.9 | 4.3 | 11.5 | 2.70 | 9 | 1 | 11 | 5 | 75.0 | 24 | 38 | 1 |
It may not always be dominant or pretty, but Soto gets the job done. Last season Soto converted 94.7% of his save opportunities, with just one blown save in 19 chances. This year he is converting 90.9% of his opportunities, which is the fourth best rate in baseball. Only Josh Hader, Daniel Bard, and Emmanuel Clase have been more effective closers.
Michael Fulmer, in contrast, converted saves at a 77.8% clip last season, and this year he was just 2-for-6 in save opportunities before he was traded to Minnesota.
For Tigers fans, the grass is always greener on the other side of the mound. Their frustrations with Gregory Soto are more about the role than the player. Soto has been an excellent closer for the Tigers. But mere excellence somehow isn’t enough when unrealistic fans expect perfection.


